Examples
These are some simple examples showing the core functionality of the
currently available pyvisi plotting objects.
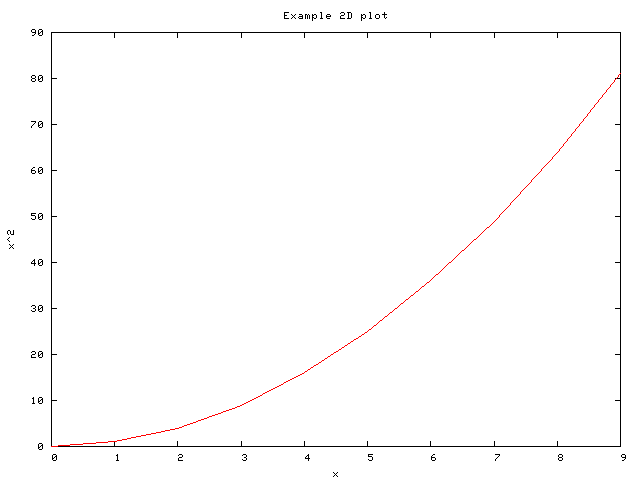
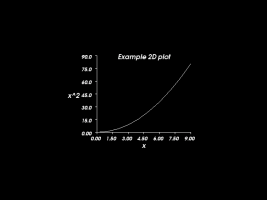
simplePlot
This is a very simple example showing how one would produce a line plot
using pyvisi. It shows a graph of y = x^2.
simpleLinePlot.py
Example pyvisi output
| Gnuplot renderer module |
Vtk renderer module |
 |
 |
| Click on image for larger version |
Click on image for larger version |
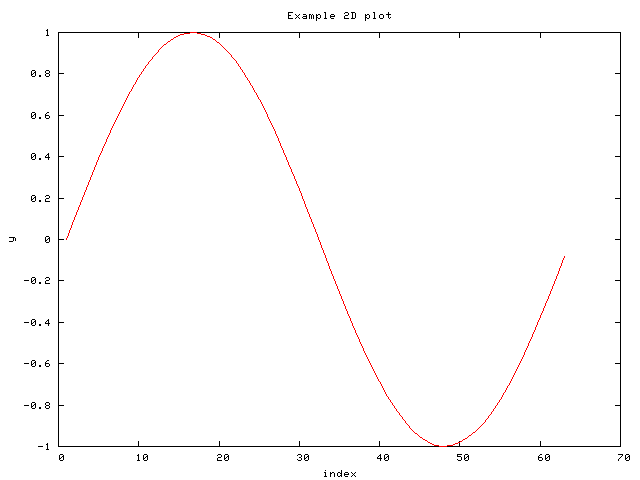
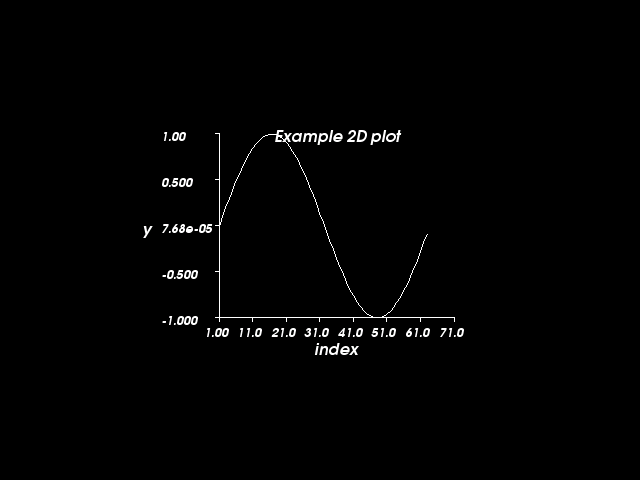
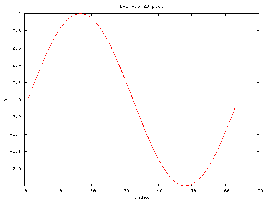
singleArrayPlot
This example shows a graph of y = sin(x). However, what is
special about it is that one only specifies the y-coordinate, and pyvisi
uses the indicies of the y array as the x-coordinate points.
singleArrayLinePlot.py
Example pyvisi output
| Gnuplot renderer module |
Vtk renderer module |
 |
 |
| Click on image for larger version |
Click on image for larger version |
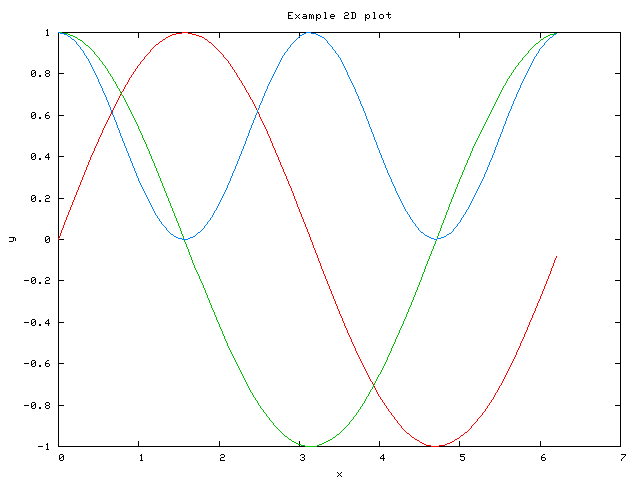
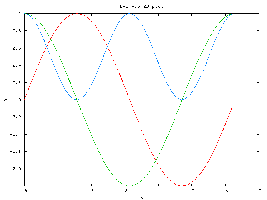
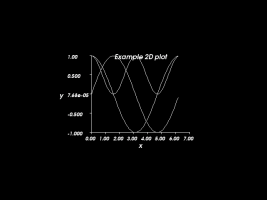
multiCurvePlot
Here we have an example of how to plot multiple curves with the same
x-coordinate variable. This example shows y = sin(x),
y = cos(x) and y = cos(x)^2.
multiCurvePlot.py
Example pyvisi output
| Gnuplot renderer module |
Vtk renderer module |
 |
 |
| Click on image for larger version |
Click on image for larger version |
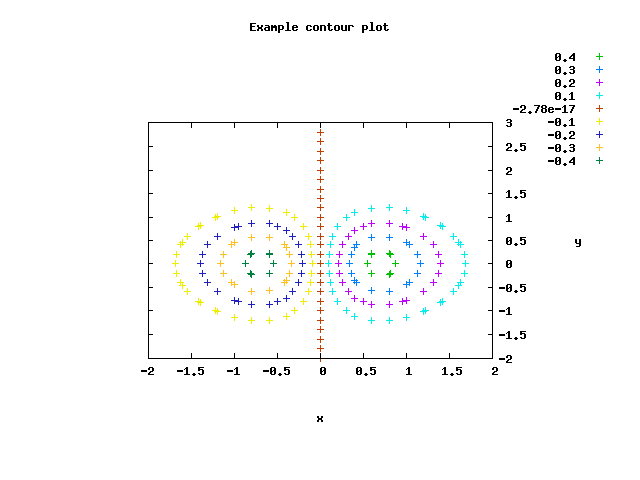
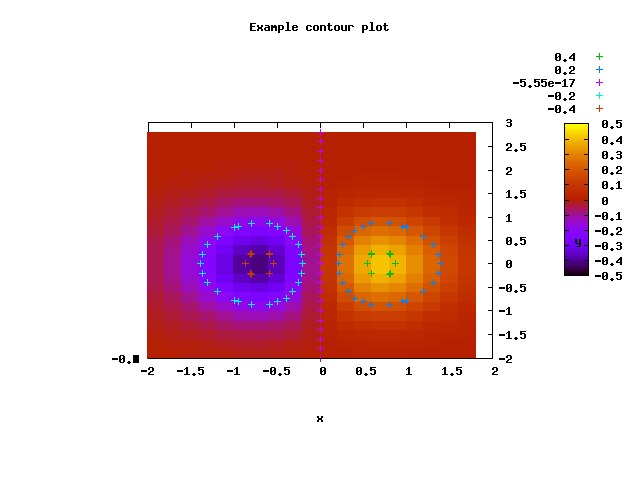
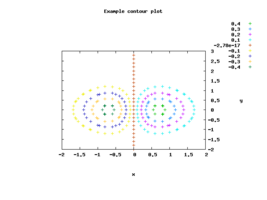
contourPlot
This shows a two-dimensional contour map of a three-dimensional surface.
The surface was generated with the equation
z = x*exp(-x^2 - y^2).
contourPlot.py
Example pyvisi output
|
Gnuplot renderer module
(gnuplot version 3.8)
|
Gnuplot renderer module
(gnuplot version 4.0)
|
 |
 |
| Click on image for larger version |
Click on image for larger version |
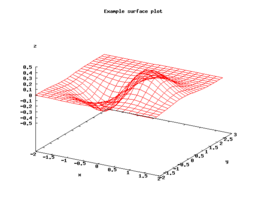
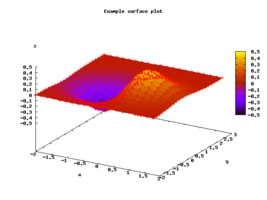
surfacePlot
This shows a three-dimensional surface. The surface was generated
with the equation z = x*exp(-x^2 - y^2).
surfacePlot.py
Example pyvisi output
|
Gnuplot renderer module
(gnuplot version 3.8)
|
Gnuplot renderer module
(gnuplot version 4.0)
|
 |
 |
| Click on image for larger version |
Click on image for larger version |
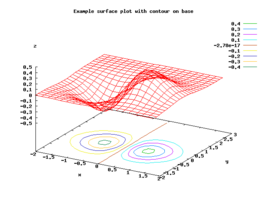
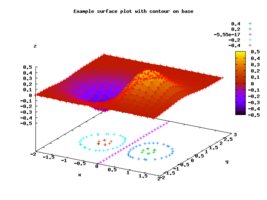
surfaceAndContourPlot
This shows a three-dimensional surface, with its contour shown on the base
of the axes. The surface was generated with the equation
z = x*exp(-x^2 - y^2).
surfaceAndContourPlot.py
Example pyvisi output
|
Gnuplot renderer module
(gnuplot version 3.8)
|
Gnuplot renderer module
(gnuplot version 4.0)
|
 |
 |
| Click on image for larger version |
Click on image for larger version |
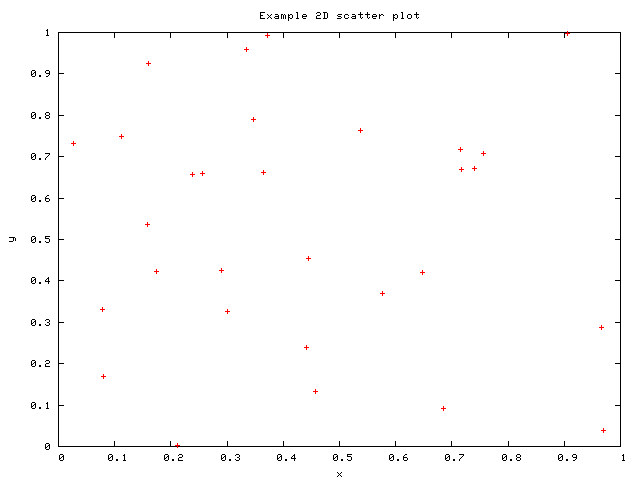
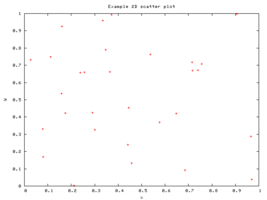
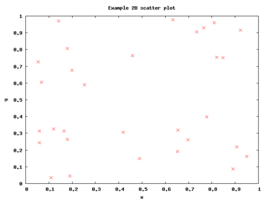
scatterPlot
Here we have randomly generated x-y data plotted as a scatter plot.
scatterPlot.py
Example pyvisi output
|
Gnuplot renderer module
(gnuplot version 3.8)
|
Gnuplot renderer module
(gnuplot version 4.0)
|
 |
 |
| Click on image for larger version |
Click on image for larger version |
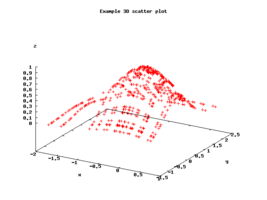
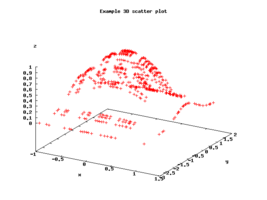
scatterPlot3D
Here we have a three-dimensional scatter plot. The x and y data are
generated randomly, and the z value is calculated via
z = exp(-x^2 - y^2).
scatterPlot3D.py
Example pyvisi output
|
Gnuplot renderer module
(gnuplot version 3.8)
|
Gnuplot renderer module
(gnuplot version 4.0)
|
 |
 |
| Click on image for larger version |
Click on image for larger version |
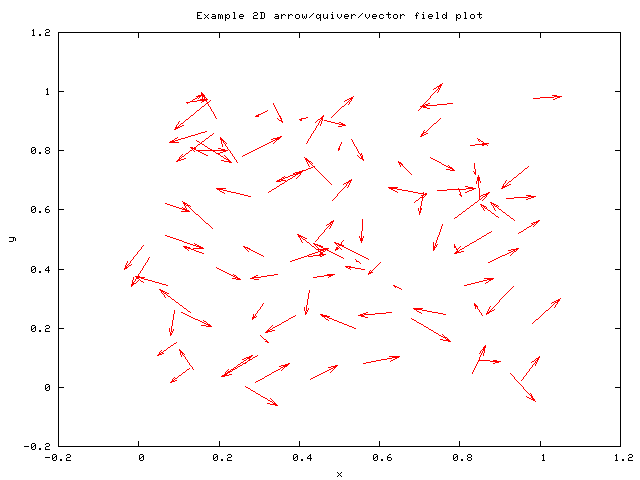
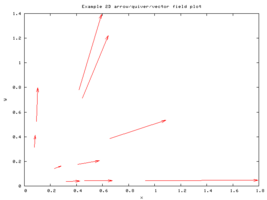
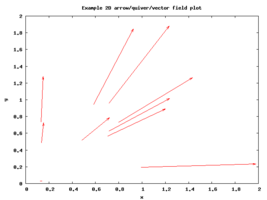
arrowPlot
This example shows a vector plot of randomly generated vectors. Here we are
only using 1D arrays as input.
arrowPlot.py
Example pyvisi output
|
Gnuplot renderer module
(gnuplot version 3.8)
|
Gnuplot renderer module
(gnuplot version 4.0)
|
 |
 |
| Click on image for larger version |
Click on image for larger version |
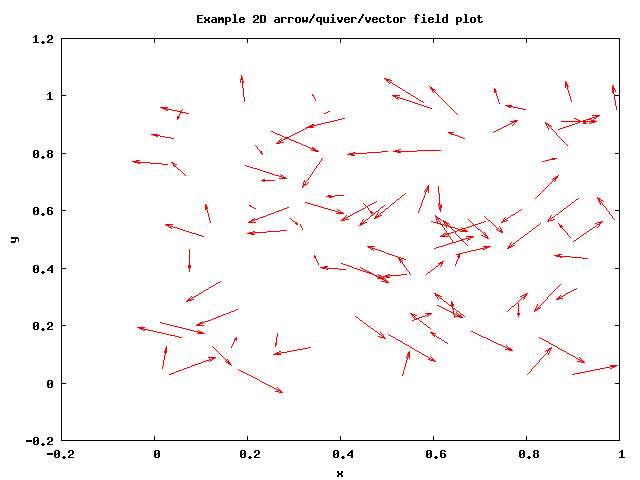
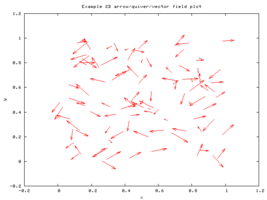
arrowPlot2D
This example shows a vector plot of randomly generated vectors. Here we are
only using 2D arrays as input.
arrowPlot2D.py
Example pyvisi output
|
Gnuplot renderer module
(gnuplot version 3.8)
|
Gnuplot renderer module
(gnuplot version 4.0)
|
 |
 |
| Click on image for larger version |
Click on image for larger version |
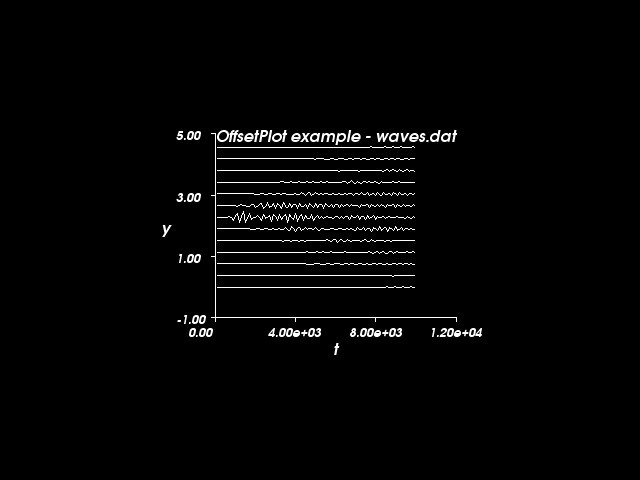
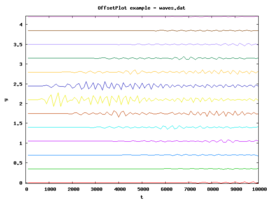
offsetPlot
This shows offset plot, or record section as is useful in seismology.
offsetPlot.py
Example pyvisi output
|
Gnuplot renderer module
|
vtk renderer module
|
 |
 |
| Click on image for larger version |
Click on image for larger version |
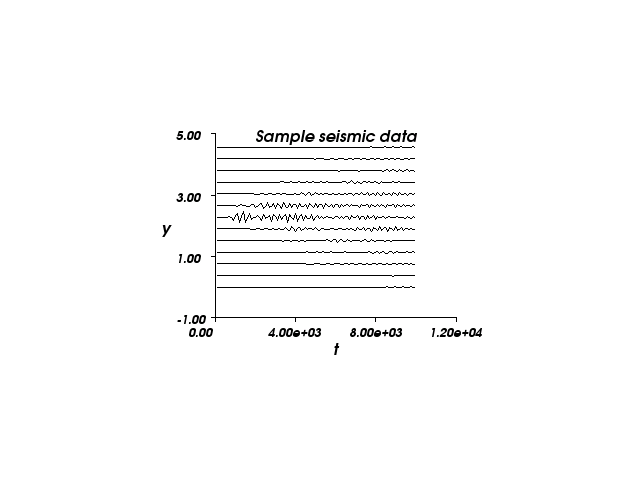
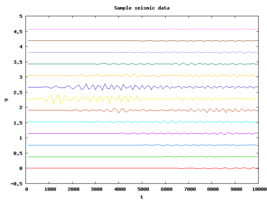
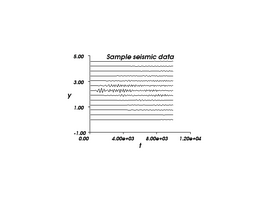
seismicOffsetPlot1
Another offset plot example with data imported from file.
seismicOffsetPlot1.py
Example pyvisi output
|
Gnuplot renderer module
|
vtk renderer module
|
 |
 |
| Click on image for larger version |
Click on image for larger version |
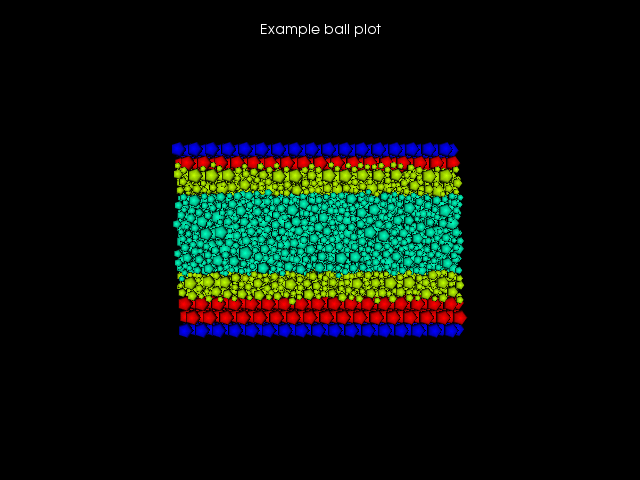
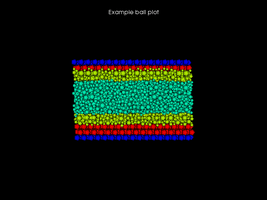
ballPlot
Plot spheres in space, loading data from a vtk xml file
ballPlot.py
Example pyvisi output
|
Povray renderer module
(unavailable at this time)
|
vtk renderer module
|
 |
 |
| Click on image for larger version |
Click on image for larger version |
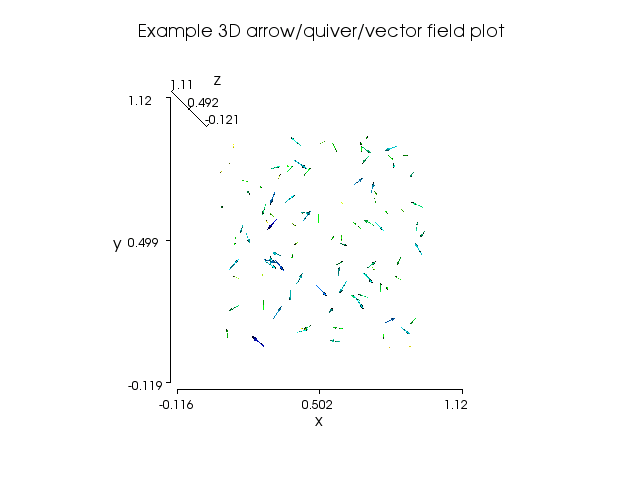
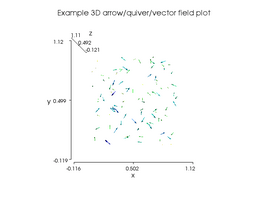
arrowPlot3D
Plot three dimensional arrows in space, loading data from a vtk xml file
arrowPlot3D.py
Example pyvisi output
|
Povray renderer module
(unavailable at this time)
|
vtk renderer module
|
 |
 |
| Click on image for larger version |
Click on image for larger version |
|


|
Last updated: Monday 27 August 2007
comments to: webmaster
|
|